Marketing ROI: This is How to Use Marketing Software to Track Revenue & ROI
There is a famous old quote about advertising that expresses a problem many marketers still recognize:
“Half the money I spend on advertising is wasted; the trouble is I don’t know which half.”
A merchant named John Wanamaker is credited with saying this over a century ago. But even today in the age of digital marketing – where every advertising tactic you execute can be tracked – many businesses struggle to understand their marketing investments.
It doesn’t have to be this way. Even small businesses can use marketing software that tracks campaigns and associates results with revenue goals.
In 2018, there is no reason to live with Wanamaker’s problem. Here’s how you can use Marketing 360® to track growth and connect your marketing to revenue. Better yet, the data is at your fingertips and constantly updated. At a glance, you can know if your marketing is working or being wasted. That allows you to take the all-important step of doing more of what works and less of what does not.
Estimating Marketing ROI
On the Marketing 360® platform, we start with what every business owner actually wants to know. Are my various marketing channels making me money?
Our main overview report shows what you’ve spent (fuel) compared to what you’re getting in revenue (you input the average revenue gain per conversion). Here is an example from a Marketing 360® eCommerce client:
(click on data charts to enlarge)
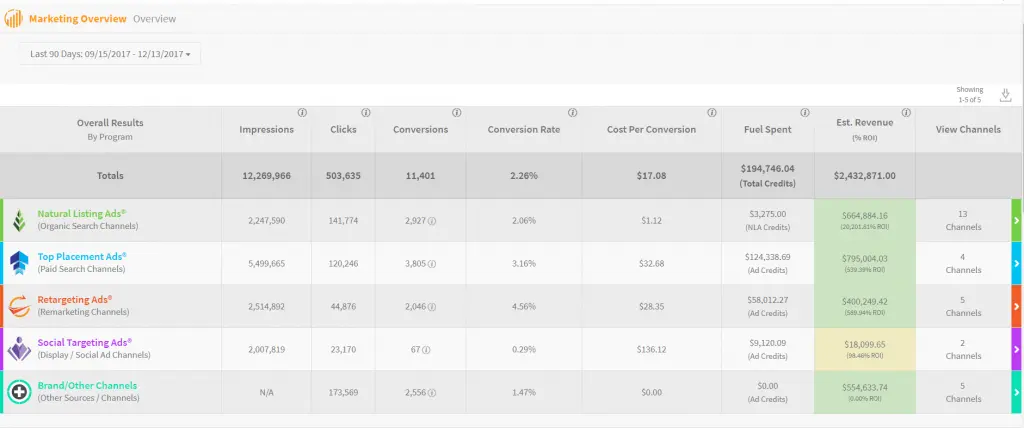
This shows a direct comparison to the total investment (Fuel) and the estimated revenue. This business, clearly, is getting huge ROI on their marketing. They can see that organic channels produce the most ROI and paid search channels produce the most actual revenue. The brand channel is driving revenue without a direct investment, though it is impacted by all the channels working together.
At a glimpse, this business owner can see the results of their marketing, tied directly to revenue numbers. They might want to invest further to extend their organic reach, while a close examination of actual profits is needed with their social advertising, where low conversion rates and a high cost per conversion may call for modifications.
Here is an overview of how this report works:
To drill down on this data, you go to the Top Line Analytics report, which breaks it down further, including the revenue streams.
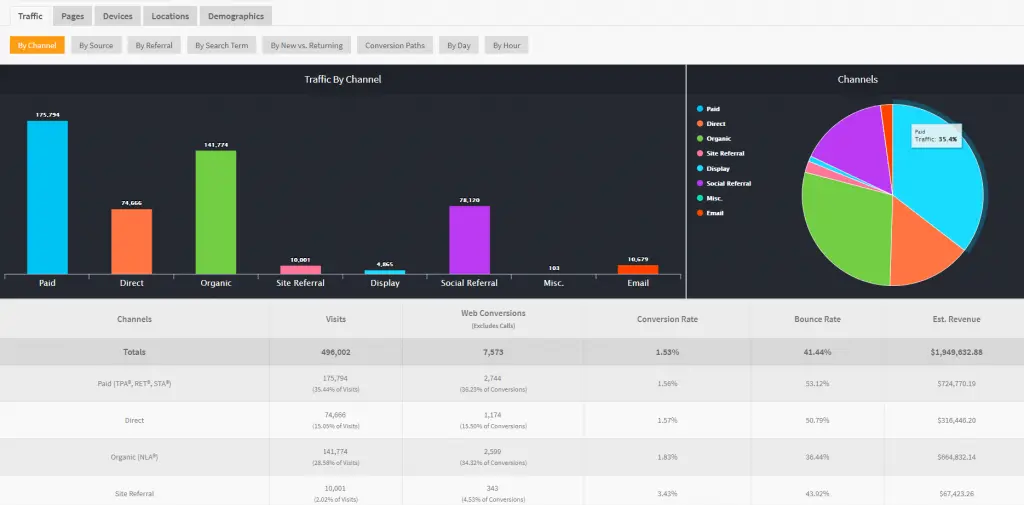
This video shows how you can examine traffic and ROI for each channel:
Tracking Results Over Time
The above reports give you an excellent view of your marketing in a time snapshot. But what’s even more telling is when you compare periods over time.
The period comparison report shows growth of your campaigns by comparing the performance over weeks, months, or a specified time frame. For example, here is the eCommerce data from the last 90 days compared to the previous 90 day period.
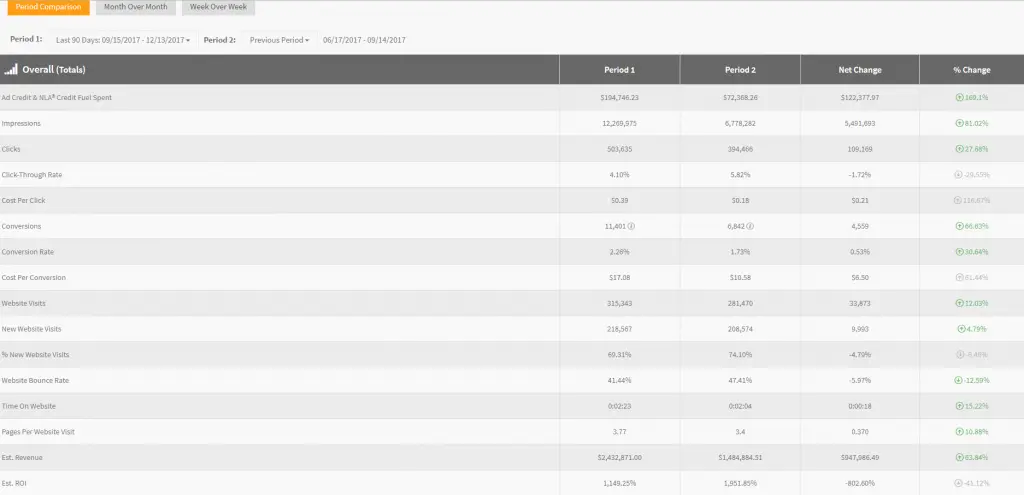
Interesting to note that they are spending more per conversion (cost per conversion has gone up 61.44%), but they’re also making more sales (estimate revenue increased by 63.84%).
Nevertheless, their ROI is down 41.12%.
But the data tells us why. During the months prior to Holiday shopping, they have increased their paid search marketing by 280.24%.

This is a good example of what we mean by a “snapshot”. For this period, ROI is down, but the paid search effort will bring in more new customers during an important sales season. With more new long-term customers, this investment has a great chance to pay off later.
You Must Know What Your Marketing is Doing
With marketing software like Marketing 360®, there is no excuse for not knowing what your marketing budget is delivering, particularly when you take snapshots of specific time periods.
Again – and this cannot be overemphasized – you use this data to identify what’s making you money as well as what’s not working. Long-term growth depends on you making informed, data-driven decisions that let you effectively target audiences and create collateral. In the end, it’s the actions you take based on the data that matter.
As you gather more of this data over longer time periods, you build out your overall profitability picture as well as calculate the lifetime value of a customer. This data gives the full picture of what marketing is doing for you.
John Wanamaker lived a long time ago. Time to turn the page.

*Results are based on past client performance. Individual account performance may vary. Results are not guaranteed.