How to Interpret & Analyze Marketing Data: 6 Tips to Clarify Marketing Analytics for SMB Owners

Marketing is about doing more of what works and less of what doesn’t.
This is a mantra we live by at Marketing 360®. But the simplicity of the phrase belies the complexity of the process behind it.
In order to identify what works – or what does not – you must use analytical data. There is never a shortage of data with digital marketing, but analyzing – and more importantly interpreting it so it can guide valuable actions – is far more challenging.
Business owners hire Marketing 360® so their marketing executive can do the heavy lifting with data analysis for them. It’s a smart strategy because data interpretation is beyond what most SMB owners want to deal with.
However, that doesn’t mean you should be oblivious to your data. Fortunately, our marketing software is designed to make it easier for business owners to interpret their marketing data (the examples we’ll show are from Marketing 360®).
Here are some tips that help you interpret your data so you can help guide actions toward more of what works.
#1. Know Your Primary KPIs
In most campaigns there are more data points than you need to follow, so you have to be strategic by knowing what your key performance indicators (KPIs) are.
For SMB lead generation and start-up eCommerce marketing, primary KPIs are generally straightforward. They include conversion rate, cost per conversion, conversions (leads generated, sales), and estimated revenue per channel.
These are the things you can take a cursory look at and get a sense of whether or not your marketing is generating any results. On Marketing 360®, the primary KPIs are part of the main report:

It’s also a good idea to have a sense of what your secondary KPIs are. These are things like top organic pages, data by device, demographics, actual search terms, and referral sources. You can view these in the Top Line Analytics report. For example, here is a video demonstrating the demographics report.
#2. Know How the Data Relates to Your Business
As we said, you shouldn’t expect to become a data analytics pro. You have enough to do, so leave that to your marketing exec.
The most important thing, rather, is that you be able to help your marketing executive help you. They can break down the data for you, but your input on how it applies to your business is invaluable.
Unfortunately, there is no template for how this works. Every business is unique.
For example, if you are an eCommerce business, you might want to look at cart abandonment rates or drop-off rates during checkout. Here, your focus is on whether or not visitors are making a purchase, and if not, what are the problem areas.
B2B sites may want to focus on time on site, page views, and leads generated. They want to see if visitors are taking the time to learn about their solution and if they’re motivated to act.
B2C might look at clickthrough rates, bounce rates, and conversion rates. They want to know if their local ads are reaching the right audience, and if the content on site matches the intent of the search they’re targeting.
Understand the business goals that give purpose to your campaigns. Know what action you want visitors to take and be prepared to look at specifics that show what’s working and what’s hanging people up.
#3. Avoid Confirmation Bias
One of the most common mistakes novices make with marketing data is to fall victim to confirmation bias, which is when you interpret the data in a way that confirms your assumption and ignore data which refutes them. This leads to serious errors because what you think is “working” – and therefore want to do more of – is not actually working.
For the small business owner, this is the most important piece of advice we have for dealing with data. What happens most often is the business owner comes up with an idea for marketing they think will be wonderful. Then, they go through the data looking for points that confirm that their idea is working.
Confirmation bias comes up a lot with organic, earned traffic. Business owners hope that SEO or social media will deliver qualified, free traffic so they skew their data interpretations to favor those tactics.
Be coldly objective when you interpret marketing data. Its job is to tell you the results of what you’re doing, not to confirm your hopes or predict the results of an untested tactic.
#4. Segment Your Audiences
One area of data analysis you do want to understand is how to segment audiences.
Digital marketing is now so precise with audience segmentation that it’s no longer a choice to just treat everyone the same. You don’t have an audience. You have audiences.
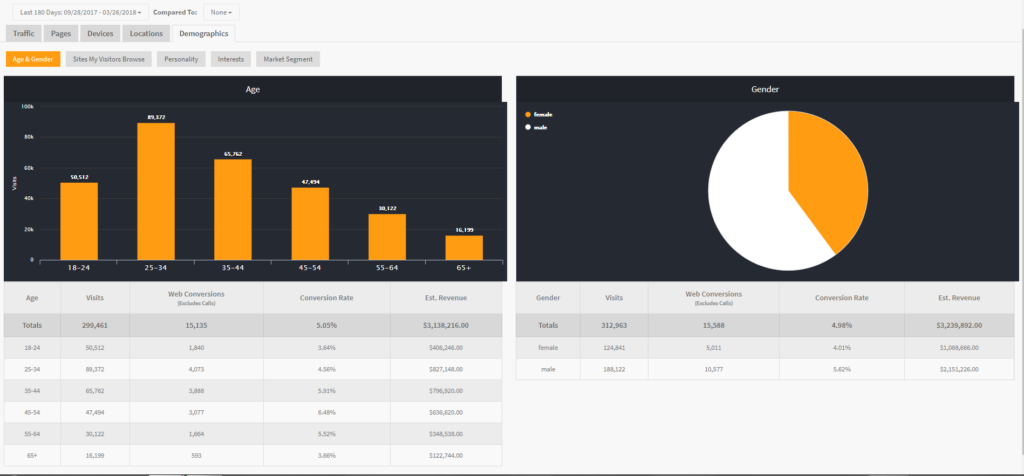
Fortunately, Marketing 360® makes viewing the main segmentation points easy in the top line analytics report. You can quickly get data on devices, locations, and demographics.
If you start doing social targeting ads, you’ll discover you can segment people with such precision it’s a bit unsettling.
Say, for example, you sell cajun-seasonings online. You can target people who are interested in Cajun and Creole food:

Want to get even more detailed? How about people who like to dine at Popeye’s Fried Chicken?
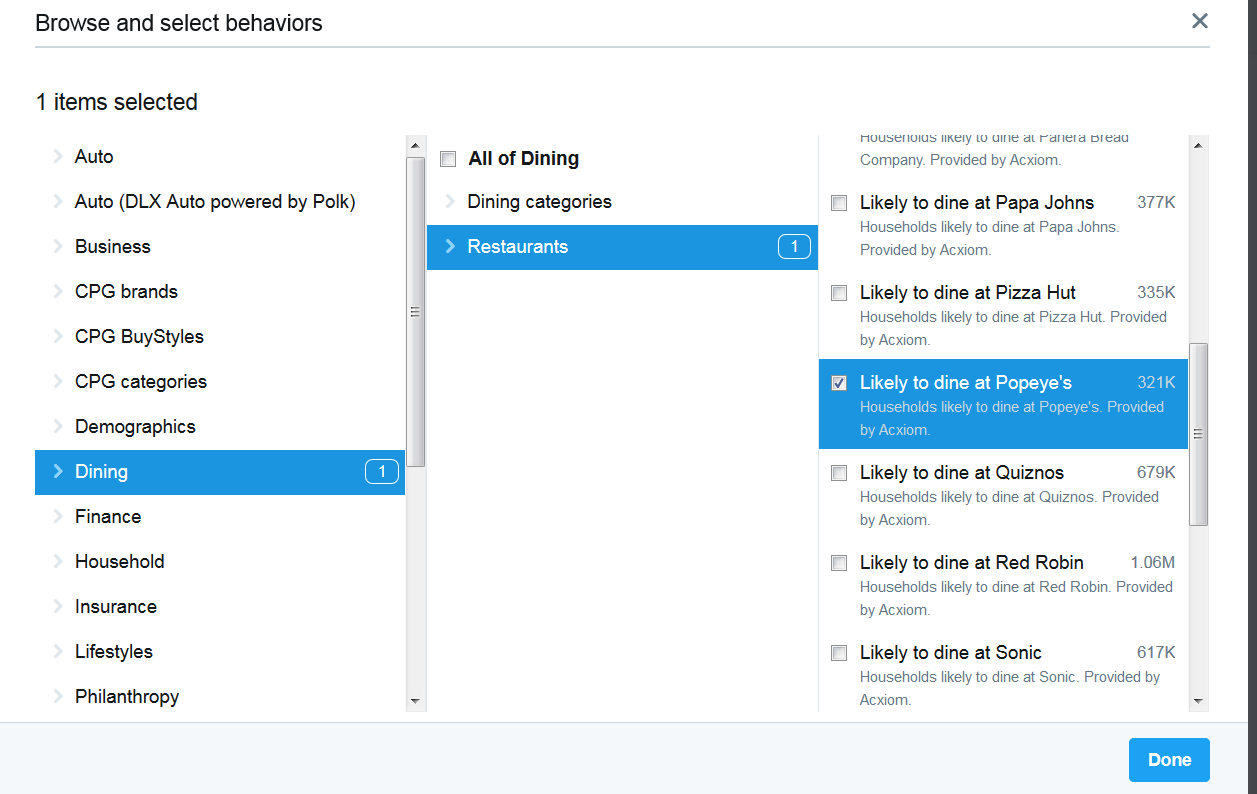
The results of this targeting will give you highly informative data based on specific criteria.
#5. Analyze More than One Metric at a Time
Something that’s probably occurring to you is that with all this data, it’s not likely that a single metric will tell much of a story.
Correct. With all of the integration that takes place through marketing channels, it’s rare that just one metric will make a valid point.
For example, you might have a conversion rate of 30%. Alone, that sounds like a great result.
However, if your impressions and clicks are very low, it will render conversion rate statistically invalid. 3 out of 10 doesn’t sound as good as 30%.
One metric you want to be careful about is keyword rankings. In both paid and organic search, you may rank a targeted keyword on page one, achieving the desired result.
But this alone means nothing if your clickthrough rates, engagement metrics, and conversions aren’t happening as a result.
One data report that’s helpful in showing you how multiple channels work together is the conversion paths report, which shows how multiple channels worked together to result in a conversion.
Again, go back to your KPIs. Make sure the metric you’re interpreting connects to your primary goals.
#6. Understand Why
In the field of statistical analysis, they make an important point.
They maintain that data can tell you the results of what you’re doing, but it can’t tell you what to do.
This is important to consider as you interpret your data. The data will show you, in concrete terms, what is happening. The metrics are based on results.
But much of the time, it won’t tell you why it’s happening. This is the difference between analyzing and interpreting data. You analyze the what. You interpret the why.
For example, say you have a landing page with high bounce rates. You know people aren’t staying on the page, but why is this happening?
You have to make assumptions and test them. You might split test your word choice, images, call to action, or offer. That data tells you what version works better.
Or you might find that the match between your ad and the page is poor. You’re not really driving traffic from the right audience. You need to change the ad to have stronger message match with the landing page.
Understanding why things are happening with your marketing material is highly valuable. Use these tips so you’re on the same page as your marketing executive.
You don’t need to understand every data detail, but you’ll feel much more comfortable with your marketing if, through data’s details, you can see the big picture.